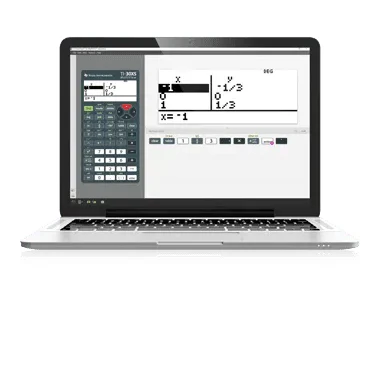
Ti-SmartView CE Software
SmartView CE Emulator Software for the TI-84 Plus Family
TI-SmartView CE software emulates the TI-84 Plus, TI-84 Plus Silver Edition, TI-84 Plus C Silver Edition and TI-84 Plus CE graphing calculators, allowing the educator to project an interactive representation of the calculators display to the entire class, an ideal demonstration tool.
To access and download the Ti-SmartView CE software after receiving your license, visit ti.software! Your license will be emailed to you within one business day.
Built-in functionality
- Emulates the TI-84 Plus family graphing calculators, including the TI-84 Plus CE calculator
- Display up to four different representations, including graph, table, equation and data list screens
- Key press history
- Collect multiple screen captures
- Add images to graph background
- Fifteen colors for function graphing
- Change style and color of axes and grids on graphs
- Catalog Syntax Help
- Alphabetical CATALOG of all TI calculator operations in one menu
- Advanced functions accessed through pull-down display menus
- Real and complex numbers calculated to 14-digit accuracy and displayed with 10 digits plus a two-digit exponent
- Graphs 10 rectangular functions, six parametric expressions, six polar expressions and three recursively-defined sequences
- Up to 10 graphing functions defined, saved, graphed and analyzed at one time
- Sequence graphing mode shows time series plot, cobweb/stair-step plot and phase plots
- User-defined list names; lists store up to 999 elements
- Seventeen interactive zoom features
- Numeric evaluations given in table format for all graphing modes
- Interactive analysis of function values, roots, maximums, minimums, integrals and derivatives
- Eight different graph styles for differentiating the look of each graph drawn
- Horizontal and vertical split-screen options
- View graph and table side-by-side
- Stores up to 10 50x50 matrices
- Matrix operations including inverse, determinant, transpose, augment, reduced row echelon form and elementary row operations; convert matrices to lists and vice-versa
- List-based one- and two-variable statistical analysis, including logistic, sinusoidal, median-median, linear, logarithmic, exponential, power, quadratic polynomial, cubic polynomial and quartic polynomial regression models
- Three statistical plot definitions for scatter plots, xy-line plots, histograms, regular and modified box-and-whisker plots and normal probability plots
- Advanced statistics features including 10 hypothesis testing functions, seven confidence interval functions and one-way analysis of variance
- Fifteen probability distribution functions including Normal, Student-t, Chi-square, Binomial and Poisson
- Business functions including Time-Value-of-Money (TVM), cash flows and amortization; full screen interactive editor for solving TVM problems
- Interactive equation solver editor allows solving numerically for different variables in an equation
- Eleven regression calculations
- The “Always in front” feature keeps your TI-Smartview™ software on top of other software windows on your desktop so it’s always visible
Applications
- Cabri™ Jr.
- CellSheet™
- Conics
- Inequality Graphing
- Periodic Table
- Polynomial Root Finder/Simultaneous Equation Solver
- Probability Simulation
- Science Tools
- Transformation Graphing
Windows® system requirements
- Windows® 10
- Compatible with 64-bit Operating Systems
- Processor: Intel Core i3 or higher generation processor (Except Intel Atom)
- RAM: 4GB
- Free hard drive space: Approximately 1 GB of available hard-disk space
- Screen resolution: 1024 x 768 (minimum) - UHD 3840 x 2160 from 1920 x 1080 (maximum)
- Active internet connection for installation
- Active internet connection required for activation
Mac® system requirements
- Mac® OS 10.14, 10.15
- Hardware: Any Mac® 2012 or later and some 2010 models
- RAM: 4GB
- Free hard drive space: Approximately 1 GB of available hard-disk space
- Screen resolution: 1024 x 768 (minimum) - UHD 3840 x 2160 from 1920 x 1080 (maximum)
- Active internet connection for installation
- Active internet connection required for activation
Single-user subscription license (PC and Mac®)
- Provides one software license for one computer
- Software is non-refundable
SmartView CE Emulator Software for the TI-84 Plus Family
TI-SmartView CE software emulates the TI-84 Plus, TI-84 Plus Silver Edition, TI-84 Plus C Silver Edition and TI-84 Plus CE graphing calculators, allowing the educator to project an interactive representation of the calculators display to the entire class, an ideal demonstration tool.
To access and download the Ti-SmartView CE software after receiving your license, visit ti.software! Your license will be emailed to you within one business day.
Built-in functionality
- Emulates the TI-84 Plus family graphing calculators, including the TI-84 Plus CE calculator
- Display up to four different representations, including graph, table, equation and data list screens
- Key press history
- Collect multiple screen captures
- Add images to graph background
- Fifteen colors for function graphing
- Change style and color of axes and grids on graphs
- Catalog Syntax Help
- Alphabetical CATALOG of all TI calculator operations in one menu
- Advanced functions accessed through pull-down display menus
- Real and complex numbers calculated to 14-digit accuracy and displayed with 10 digits plus a two-digit exponent
- Graphs 10 rectangular functions, six parametric expressions, six polar expressions and three recursively-defined sequences
- Up to 10 graphing functions defined, saved, graphed and analyzed at one time
- Sequence graphing mode shows time series plot, cobweb/stair-step plot and phase plots
- User-defined list names; lists store up to 999 elements
- Seventeen interactive zoom features
- Numeric evaluations given in table format for all graphing modes
- Interactive analysis of function values, roots, maximums, minimums, integrals and derivatives
- Eight different graph styles for differentiating the look of each graph drawn
- Horizontal and vertical split-screen options
- View graph and table side-by-side
- Stores up to 10 50x50 matrices
- Matrix operations including inverse, determinant, transpose, augment, reduced row echelon form and elementary row operations; convert matrices to lists and vice-versa
- List-based one- and two-variable statistical analysis, including logistic, sinusoidal, median-median, linear, logarithmic, exponential, power, quadratic polynomial, cubic polynomial and quartic polynomial regression models
- Three statistical plot definitions for scatter plots, xy-line plots, histograms, regular and modified box-and-whisker plots and normal probability plots
- Advanced statistics features including 10 hypothesis testing functions, seven confidence interval functions and one-way analysis of variance
- Fifteen probability distribution functions including Normal, Student-t, Chi-square, Binomial and Poisson
- Business functions including Time-Value-of-Money (TVM), cash flows and amortization; full screen interactive editor for solving TVM problems
- Interactive equation solver editor allows solving numerically for different variables in an equation
- Eleven regression calculations
- The “Always in front” feature keeps your TI-Smartview™ software on top of other software windows on your desktop so it’s always visible
Applications
- Cabri™ Jr.
- CellSheet™
- Conics
- Inequality Graphing
- Periodic Table
- Polynomial Root Finder/Simultaneous Equation Solver
- Probability Simulation
- Science Tools
- Transformation Graphing
Windows® system requirements
- Windows® 10
- Compatible with 64-bit Operating Systems
- Processor: Intel Core i3 or higher generation processor (Except Intel Atom)
- RAM: 4GB
- Free hard drive space: Approximately 1 GB of available hard-disk space
- Screen resolution: 1024 x 768 (minimum) - UHD 3840 x 2160 from 1920 x 1080 (maximum)
- Active internet connection for installation
- Active internet connection required for activation
Mac® system requirements
- Mac® OS 10.14, 10.15
- Hardware: Any Mac® 2012 or later and some 2010 models
- RAM: 4GB
- Free hard drive space: Approximately 1 GB of available hard-disk space
- Screen resolution: 1024 x 768 (minimum) - UHD 3840 x 2160 from 1920 x 1080 (maximum)
- Active internet connection for installation
- Active internet connection required for activation
Single-user subscription license (PC and Mac®)
- Provides one software license for one computer
- Software is non-refundable
Original: $14.49
-65%$14.49
$5.07Description
SmartView CE Emulator Software for the TI-84 Plus Family
TI-SmartView CE software emulates the TI-84 Plus, TI-84 Plus Silver Edition, TI-84 Plus C Silver Edition and TI-84 Plus CE graphing calculators, allowing the educator to project an interactive representation of the calculators display to the entire class, an ideal demonstration tool.
To access and download the Ti-SmartView CE software after receiving your license, visit ti.software! Your license will be emailed to you within one business day.
Built-in functionality
- Emulates the TI-84 Plus family graphing calculators, including the TI-84 Plus CE calculator
- Display up to four different representations, including graph, table, equation and data list screens
- Key press history
- Collect multiple screen captures
- Add images to graph background
- Fifteen colors for function graphing
- Change style and color of axes and grids on graphs
- Catalog Syntax Help
- Alphabetical CATALOG of all TI calculator operations in one menu
- Advanced functions accessed through pull-down display menus
- Real and complex numbers calculated to 14-digit accuracy and displayed with 10 digits plus a two-digit exponent
- Graphs 10 rectangular functions, six parametric expressions, six polar expressions and three recursively-defined sequences
- Up to 10 graphing functions defined, saved, graphed and analyzed at one time
- Sequence graphing mode shows time series plot, cobweb/stair-step plot and phase plots
- User-defined list names; lists store up to 999 elements
- Seventeen interactive zoom features
- Numeric evaluations given in table format for all graphing modes
- Interactive analysis of function values, roots, maximums, minimums, integrals and derivatives
- Eight different graph styles for differentiating the look of each graph drawn
- Horizontal and vertical split-screen options
- View graph and table side-by-side
- Stores up to 10 50x50 matrices
- Matrix operations including inverse, determinant, transpose, augment, reduced row echelon form and elementary row operations; convert matrices to lists and vice-versa
- List-based one- and two-variable statistical analysis, including logistic, sinusoidal, median-median, linear, logarithmic, exponential, power, quadratic polynomial, cubic polynomial and quartic polynomial regression models
- Three statistical plot definitions for scatter plots, xy-line plots, histograms, regular and modified box-and-whisker plots and normal probability plots
- Advanced statistics features including 10 hypothesis testing functions, seven confidence interval functions and one-way analysis of variance
- Fifteen probability distribution functions including Normal, Student-t, Chi-square, Binomial and Poisson
- Business functions including Time-Value-of-Money (TVM), cash flows and amortization; full screen interactive editor for solving TVM problems
- Interactive equation solver editor allows solving numerically for different variables in an equation
- Eleven regression calculations
- The “Always in front” feature keeps your TI-Smartview™ software on top of other software windows on your desktop so it’s always visible
Applications
- Cabri™ Jr.
- CellSheet™
- Conics
- Inequality Graphing
- Periodic Table
- Polynomial Root Finder/Simultaneous Equation Solver
- Probability Simulation
- Science Tools
- Transformation Graphing
Windows® system requirements
- Windows® 10
- Compatible with 64-bit Operating Systems
- Processor: Intel Core i3 or higher generation processor (Except Intel Atom)
- RAM: 4GB
- Free hard drive space: Approximately 1 GB of available hard-disk space
- Screen resolution: 1024 x 768 (minimum) - UHD 3840 x 2160 from 1920 x 1080 (maximum)
- Active internet connection for installation
- Active internet connection required for activation
Mac® system requirements
- Mac® OS 10.14, 10.15
- Hardware: Any Mac® 2012 or later and some 2010 models
- RAM: 4GB
- Free hard drive space: Approximately 1 GB of available hard-disk space
- Screen resolution: 1024 x 768 (minimum) - UHD 3840 x 2160 from 1920 x 1080 (maximum)
- Active internet connection for installation
- Active internet connection required for activation
Single-user subscription license (PC and Mac®)
- Provides one software license for one computer
- Software is non-refundable